After leaving BridgePoint, it was time to get started with YAKINDU Statechart Tools. Let’s start with an official introduction of YAKINDU Statechart Tools from its website:
The free to use, open source toolkit YAKINDU Statechart Tools (SCT) provides an integrated modeling environment for the specification and development of reactive, event-driven systems based on the concept of statecharts.
Following figures are from the website of YAKINDU Statechart Tool.

Editing
SCT features an intuitive combination of graphical and textual notation. While states, transitions and state hierarchies are graphical elements, all declarations and actions are specified using a textual notation. The usability of the statechart editor is simply fascinating.

Validation
The validation of state machines includes syntax and semantic checks of the full model. Examples of built in validation rules are the detection of unreachable states, dead ends and references to unknown events. These validation constraints are checked live during editing.

Simulation
The simulation of state machine models allows the dynamic semantics to be checked. Active states are directly highlighted in the statechart editor and a dedicated simulation perspective features access to execution controls, inspection and setting variables, as well as raising events.

Code generation
SCT includes code generators for Java, C and C++ out of the box. The code generators follow a code-only approach and do not rely on any additional runtime library. The generated code provides a well-defined interface and can be integrated easily with any client code.
After the marketing part, let’s get some hands-on experience with Yakindu. It has a really intuitive and exhaustive documentation with lots of tutorials and video instructions. One can get familiar with Yakindu in an hour or so.
Transforming BridgePoint models to Yakindu statecharts
As I mentioned in the previous parts of this post series (#1, #2), I designed a lot of state machines in xtUML BridgePoint Editor. However, we had some serious issues with BridgePoint, so we switched for Yakindu Statechart Tool. We hoped it would be a statechart designer suite that enables simulation and code generation too.
Since BridgePoint follows the xtUML methodology is based on Shlaer-Mellor Method of Model-Driven Architecture that is an object-oriented software development methodology (more on Wikipedia). This means we can design the structure of the state machine hierarchy in a class diagram manner depicted in the next figure.

As you can see classes can inherit from each other, however multiple inheritance is not allowed. This inheritance is similar to the virtual function concept of C++, and the abstract method concept of Java and C#. This means if the superclass does not handle an event, then its subclass must handle it. However it is not possible to redefine an event in subclass, that has already been handled by the superclass.
In Yakindu Statecharts this object-oriented concept is not followed, because it would be quite weird. Instead, we had to translate this in some respect hierarchical structure to a more convenient one.
That’s why we created a separate SCT model for the Section and the Turnout. Within each model we designed a hierachical statechart that consists of parallel regions, let’s see.
Section

We introduced a general statechart for the Sections. It means in the figure above you can see that the Section was connected to the Turnout through three associations, which describes from which direction the Section connects to the Turnout (of course only one association was valid for each Section instance).
Now, this information is stored in a variable, called direction, which may have three values: STRAIGHT, DIVERGENT, TOP. In the statechart all the messages are compared to this direction value, and in this way the concept of direction has been preserved for the ‘safety logic’ protocol.
The statechart of the OccupiedSection, depicted below, can be compared to the former version here that was designed in BridgePoint.

Turnout

The highest-level statechart of the Turnout is responsible for differentiating the recent direction of the Turnout. It means, whether the Turnout connects the straight – top or the divergent – top sections. In this way the former large columns of inheritance hierarhcy (depicted above) have been replaced with two composite states which contain parallel regions.
As an example the StraightTurnout state now handles the possible events in five parallel regions. This way multiple events can be handled from the safety logic protocol’s perspective, at one time. In the former version, if a lock request has been received by the Turnout, then it rejects and further requests. In the recent version it now handles the parallel requests independently. The statechart is too complicated to be depicted in this post, but you can see it on an external link here.
Validation
Yakindu Statechart Tool has a built-in validation framework for syntax and semantic checks of the created models.
It includes the
detection of unreachable states, dead ends and references to unknown
events. These validation constraints are checked live during editing.
E.g. for the Turnout model it found that several choice nodes, do not have a default outgoing transition. So it can be a problem, if at runtime there is no valid outgoing transition from a choice node.
Simulation
We have not tried the Simulator for our models, because we were so eager to see the generated code working with the model railway track, that we skipped this stage.
Code generation
We used the built-in Java code generator to generate code from the statecharts. We connected the Section and Turnout models through the interfaces of the generated codes.
If they raise an event, that should be dispatched to each other, then it goes through the interfaces of the separate statecharts. In this way all statecharts are separated, can be configured and run individually.
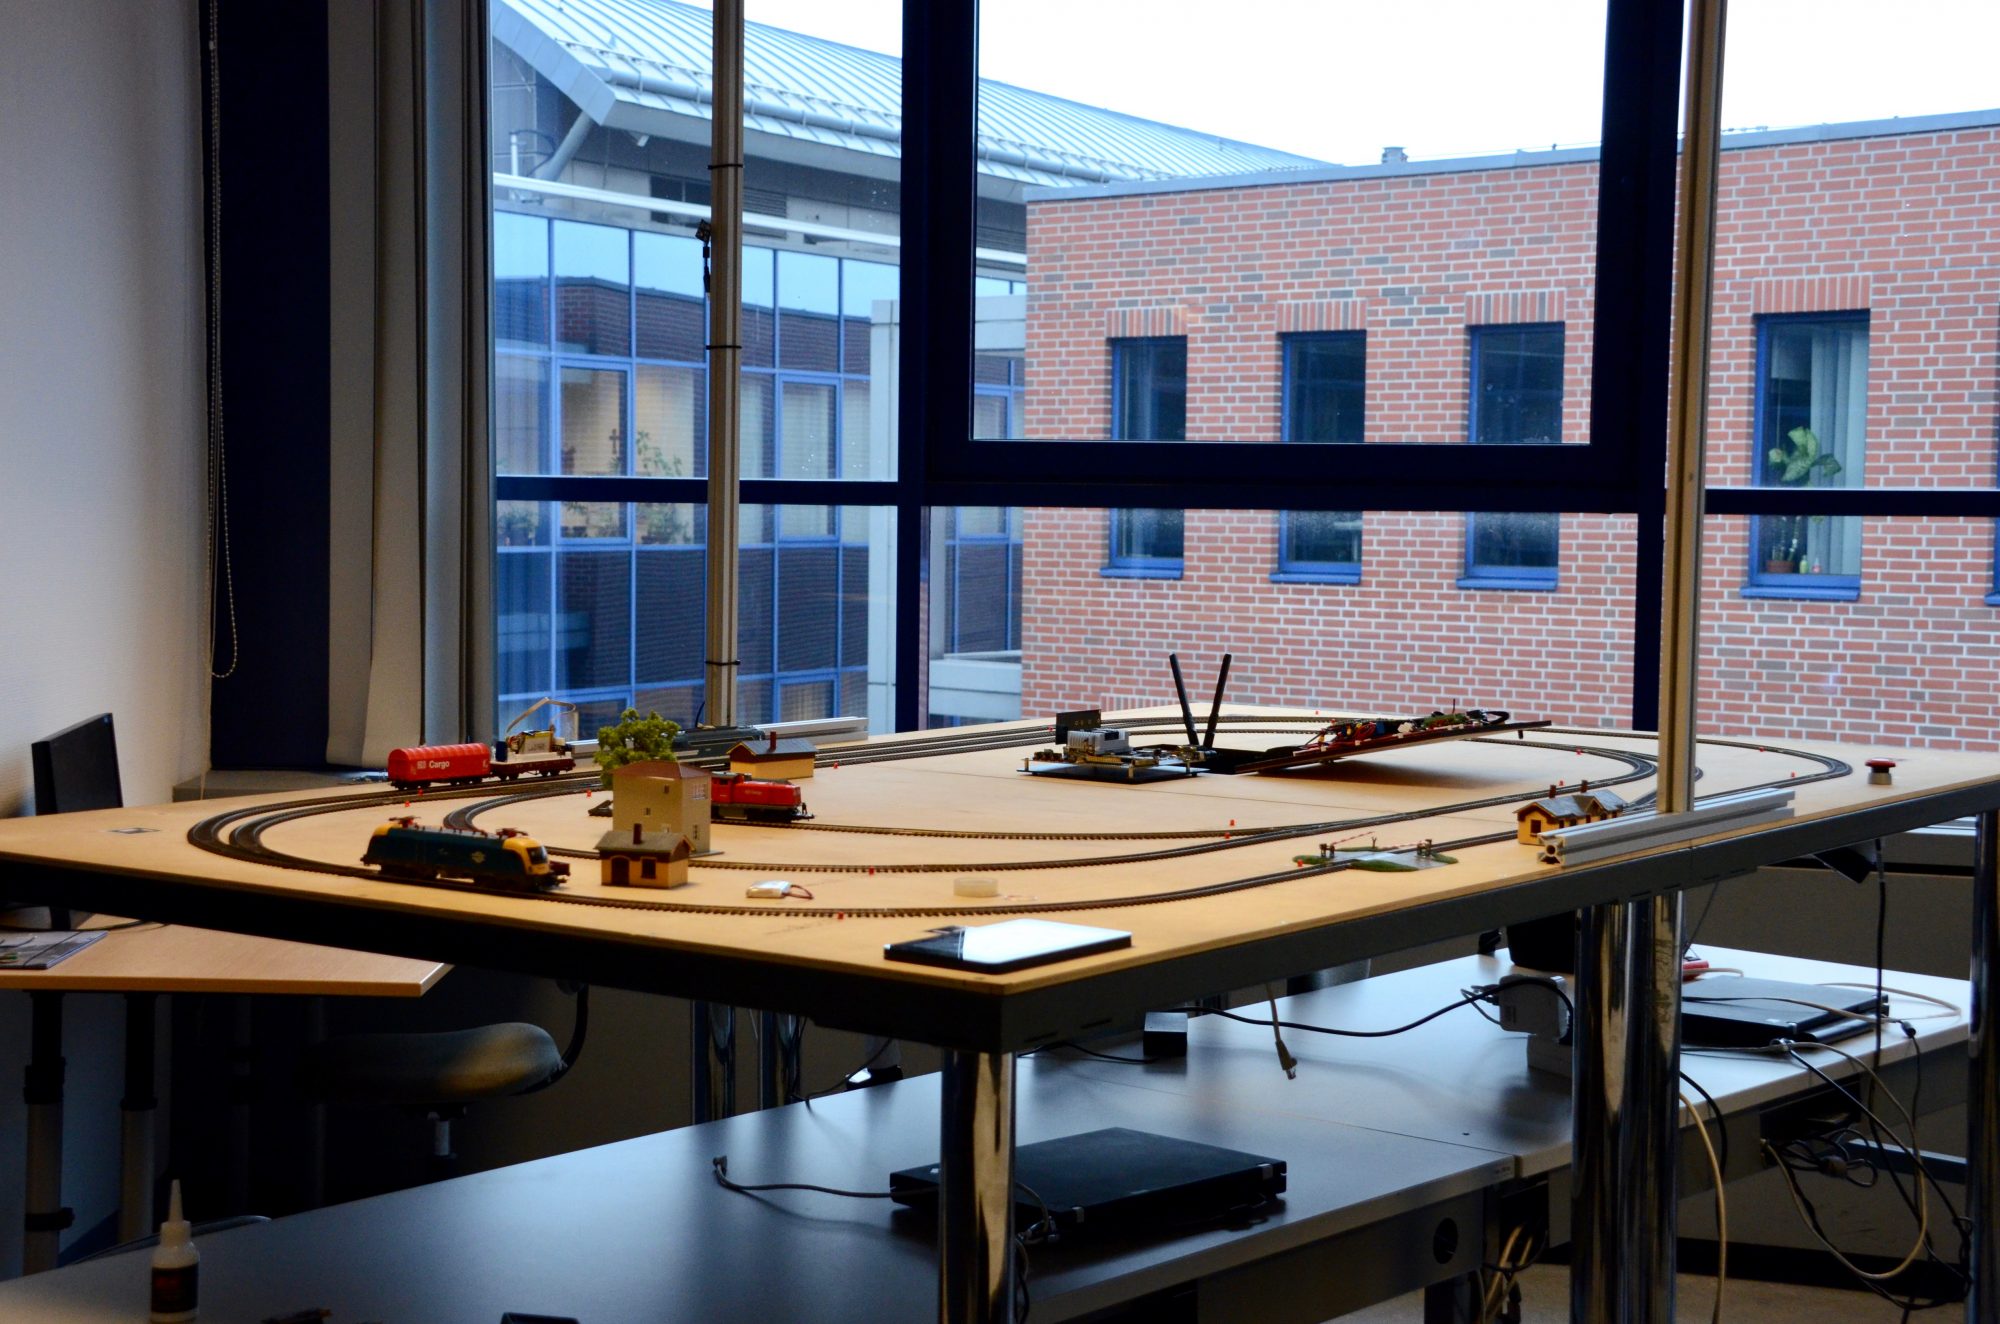
Besides, we integrated our codebase, that is necessary to communicate with the model railway track’s embedded controllers, with the statecharts, so we managed to get the statecharts control and stop the trains if any dangerous situation emerges.
This way the ‘safety logic’ controls the model railway track finally.
