Controlling and ensuring safety of the Lego robot arm: the computer vision challenge

As the Lego robot arm executes a mission, information about the environment is required. Beside executing missions correctly, our goal is to detect any kind of danger caused by the robot. The goal is twofold: the robot has to know when to execute a mission i.e. the object to be moved is at the right place. Second, it has to stop when some dangerous situation happens, for example a human is present near to the robot.

We are building the monitoring infrastructure of the robot arm based on computer vision technologies. OpenCV helps us detecting and tracking the movements of the robot In case of a moving robot, no other moving objects should be there. In addition, computer vision will detect if the object to be transported is in the proper place to handle by the robot.

First time we built only a robot arm with limited functionality. According to the experiences, we have totally rebuilt it.

Rebuilding the robot was a big step forward for the project’s computer vision goals. Now, we are able to detect the orientation and also the movement of the arm, without markers.

The new concept is to put on some Lego element in a combination to form a larger component with distinctive shape and colour. The camera observes the whole loading area from the top, and searches for the elements.

Using the same camera frames, we can detect the orientation of the gripper and find the cargos and the train.

For the gripper we needed a marker and that Lego element which we talked about before. The marker is directly connected to the gripper’s motor, so it is moving with the gripper during the rotation and other movements. The orientation is compared to the arm’s orientation so it won’t change during the movement of the arm, only the rotation influences its settings. The marker is a black circle, therefore we replaced the color detection with circle detection for this case.

Cargo has distinctive color.

In the following picture the output of the various steps of the process is depicted.

Output of the image processing steps

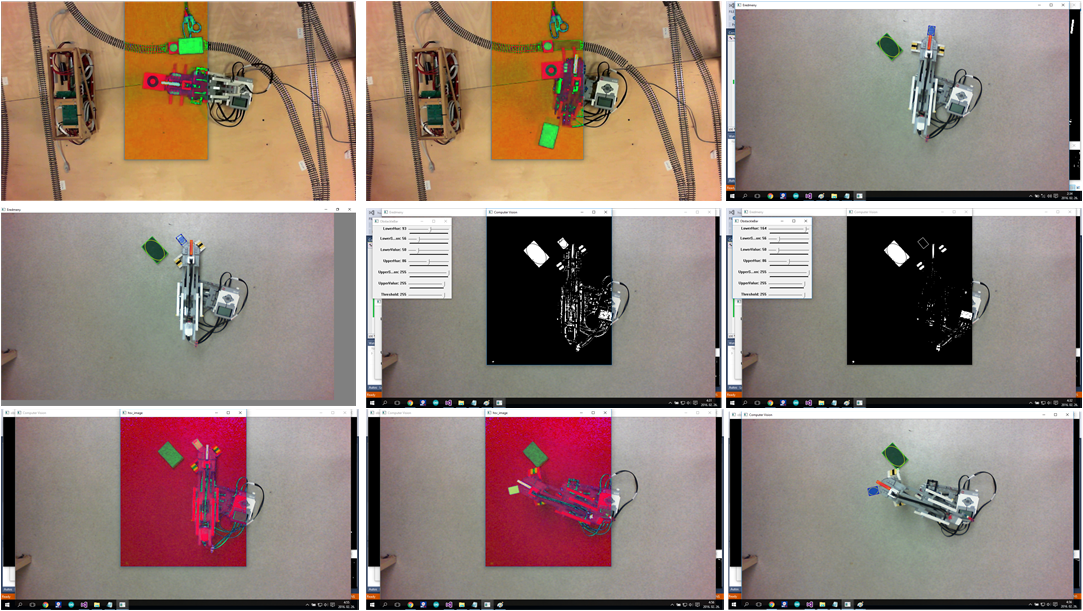
In the following we just sketch the working of the detection algorithms. Transforming the picture of the camera to HSV (Hue-Saturation-Value) representation. This will serve as a base representation for further processing. The next step is to decompose the picture according to the information we are looking for. In order to ease the tasks of the further processing, the picture is cut into pieces: The Lego arm, the gripper and also the object to be moved will be in different pieces of the picture.

Detecting the various objects of interest, we need to assess the color and the size of the objects in the picture: this is assessed at the next phase of the processing.

Edge detection algorithms search for the contour of the objects. Pattern matching algorithms try to find rectangles in the picture.

Numerical filters than used to sort the found objects (rectangles) according to their size. From the filtered objects, some special heuristics filter those object which are likely to be the searched object, namely the arm, the gripper and the load to be moved.

The movement of the arm is traced by reducing the problem to finding the moving rectangles in the filtered picture. Computing averages and tracing the middle point of the objects provide quite precise results.

So, as you might see, many algorithms work on the control and safety assurance of the Lego robot arm. Despite its complexity, it works well in practice!

Complex Event Processing #2

So let’s continue the introduction of the complex-event processing work of our IoT challenge project.

In a former post you could read about the computer vision, which will provide the information for the complex-event processing engine. However, answering the question of what and how to process relies only on the complex-event processing. Now, we give some details about our extensions of the VIATRA-CEP framework. Note that it has not yet been merged: we plan to integrate them in the future!

Just a reminder about the workflow of the imagined CEP compiler:

Formalisms

The general idea of the extensions proposed in this project relies on our former work with VIATRA-CEP.

Regular languages were chosen according to their semantics, traditional automata transformation were planned to be used for supporting the work of the execution.

Now let’s see what have been implemented, and how it was done. We have developed the metamodel of the automata representation in EMF. In addition, several executor-related classes had to be developed in Xtend.

EMF model of the Automaton

As the intermediate language is intended to be used as a semantic integration layer, Xtext is used to implement a Regular Expression language.

Various transformations are used to generate the monitoring from the high level requirements description. As the regular formalisms are introduced into the system, we gain two main advantages:

  1. The semantics of the languages are familiar for the developers as regular languages are widely used in various areas of software engineering.
  2. Existing transformation algorithms could be utilized.

From the Regular Expressions, without timing and parameters, a transformation to automata is well-known in the literature so my task was quite simple. I found a well-specified algorithm and I implemented and integrated the compiler to the system. Also note that this algorithm generates a deterministic automaton which can be executed with a single active state, also known as token. This point is really important!

When using monitoring in resource constrained environments, it is useful to be able to give limits for the resource usage. This can be provided by deterministic automata.The timed part of the work was much more difficult!

One of our main goals was to keep the transformed automata deterministic – but as we found out it is mathematically impossible.

Summary

Our extensions will increase the usability of the VIATRA-CEP engine and hopefully enable us to limit the resource consumption of the engine. An additional advantage is that we plan to support the analysis of the CEP specification: this automata theoretic approach can help identifying design problems in the rules with the application of rigorous formal techniques.

Computer vision based safety-system: how to get the information

The system we described was originally operated by distributed units, called masters. These masters got the local information about occupancy through a special circuit integrated into the board. However, network problems often caused the error in the safety-logic, so we decided to introduce an additional layer of safety based on computer vision and complex event processing.

Now, we will give some details about the application of computer vision for recognizing the trains and their location.

The safety logic deployed to the embedded controllers have binary information of the trains, namely if a train is on a section of the system, we detect it. There is no information about the direction of travel, and speed. Because these limitations, the information of the safety logic is rather limited.

Because the logic itself cannot determine the direction, it must consider the worst-case scenarios. This causes deadlocks, and unnecessary stops. This is a price we pay for safety.

The previously mentioned solution operates in a distributed manner. It’s safe, it’s reliable, it’s formally verified. If everything works correctly.

So we decided to implement the runtime verification of the local components and we integrated the system level monitor based on computer vision. We show the later now in details.

Our monitoring solution is a computer vision based one, using the open-source OpenCV framework. OpenCV is a very extensive library of optimized image processing, machine learning algorithms, ideal for quick development of computer vision based applications. You are not worried about the performance and programming complexity.

There are other solutions maybe with better performance, however as OpenCV is open-source and there is a huge community behind it, our decision was straightforward.

This is an example marker we use on the top of the trains. There are three markers: red, green, and a blue one.

Our needs were pretty simple: identify the trains, and determine their positions. Circular patterns are great for this kind of computer vision tasks, because if you rotate a circle, nothing happens, therefore you don’t have additional complexity.

So we decided to use markers to make our task easier!

Many of the people reading this article may think about the Hough circle algorithm, which can find circular patterns. The problem with this algorithm is it’s genericity: our board may contain many circles, not just only the train. We needed an error prone algorithm, which can match a specific pattern, if only a partial circle is visible.

What we can do is use some math. Instead of traditional pattern matching, we can turn this into a math problem. Our pattern is very static. By static, I mean the circle pattern doesn’t vary by size. Because of this property, we can create a very specific matcher, using convolution. Convolution is basically two math functions, and we apply one function on the other. The resulting function is the combination of the two. Although convolution is quite difficult to achieve, but if we transfer our image to the frequency domain, the convolution basically becomes a multiplication which is easy to do.

Let’s see an example what is happening:

  1. We create a pattern image, with specific values. These values can be: 0, if we are not interested what’s really there; 1, if we want this area white; -1, if we want this area black.
  2. Convert this pattern image to frequency domain.
  3. Read the image from camera.
  4. Convert this image to the frequency domain.
  5. Multiply the two spectra.
  6. Convert the multiplied image back.

The pattern

This is a pattern, where green has value 0, white has value 1, and black has value -1

The image from the camera looking down the MoDeS3 board

The camera image’s, and the pattern’s convolution result

This is not a pitch black image, if you look closely, you can see the bright points, which marks the points where markers found

Now we have a weird-looking image, where a brighter spot means a bigger match between an image, and the pattern. On this image, we can use a simple threshold, and get a binary image, where it is really trivial to find the brightest points.

We are not saying this is the most efficient algorithm for this solution, but it’s really robust, and precise. The precision is in the millimetre range, and it’s robustness can be described as this solution does not make false detection. It might not detect valid points for a small time period, but we haven’t seen false reading, not even in a 8-hour-long session. On the other side, Complex Event Processing can solve the problem when false values are observed for a small time interval.

So what’s after the detection of the circle pattern? There is a color ID inside the two circle patterns, and this color identifies the train. What we do is search for points, where the distance of these two points exactly matches the distance in the real world. If we find a pair, we can be sure it’s a train marker. After idetifying all the visible trains, we convert the data to JSON, and publish it to the MQTT broker.

Our approach may seem a little non-standard, but it’s proven it’s reliability, and after all, that’s what matters for us.

Complex Event Processing #1

I am Laszlo, and I am currently working on a Complex Event Processing Engine, which could be later integrated to the VIATRA-CEP project. This post will present the theoretical aspects, and the some other things excluding the implementation.

The motivation behind all of my work is simple: In our Scientific Students’ Conference Report we developed a system with multiple levels of runtime verification, and the system level verification was implemented with Complex Event Processing. For that, we have used the Open Source VIATRA-CEP framework which is part of the well-known VIATRA Eclipse project.

The reason for choosing this incredibly novel framework, is simple: It can be easily integrated on the top of live models. To do so the user can define graph patterns with EMF-IncQuery on these EMF models and use the appearance/disappearance of such graph patterns as atomic events in defining complex event patterns.

VIATRA-CEP uses an expressive event pattern language for the complex event pattern definitions. This language is called Viatra Event Pattern Language (or VEPL for short). This language is great for clear CEP proposes, but it lacks a truly clear and analyzable semantics and execution. Without explaining the grammar of this language I just show you a simple illustrative example of usage.

VEPL example

Of course instead of using atomicEvents it would be wise to use query events but that would just make this example longer. To show you, what I am working on right now let’s take a closer look to the architecture of the VIATRA-CEP

Architecture of the VIATRA-CEP

To extend this system towards the world of runtime verification, our idea was to create a similar language to VEPL but with the semantics of regular expressions. Also our plans are to map the VEPL to our Regular Expression language for debug and analysis purposes.

Architecture with the intermediate language

To create this intermediate language layer so we first developed a Parametric Timed Regular Expression formalism, which extends the well-known regular expressions with timing and parameters. For accepting languages generated by parametric timed regular expressions, we introduced the concept of the parametric timed event automata.

Formalisms

It’s always good to help!

Yesterday I was playing around the Texas Instruments 4.4 real-time kernel. After installing the image it turned out the script copying the contents of the SD card to the eMMC script was broken.

After some poking around, and debugging I found the source of the mystery, and opened an issue with the solution.
https://github.com/RobertCNelson/boot-scripts/issues/20

Just after some hour, RobertCNelson, the maintainer of everything in the BeagleBone Black project issued a fix. That was fast!

Runtime verification in the MoDeS3 project – an introduction

Most of us get in elevators, ride trains and board airplanes without thinking about the danger. It became widespread to trust technology – or at least those parts that have been surrounding us ever since we were born. We were taught that these devices are safe. Nothing operates perfectly of course, but these devices manage to keep the severity of failures to a minimum somehow. However, in the IT world, having a few errors in projects with millions of lines of code is more than common. So how is it that these systems can still operate safely?

 Safety critical development

In safety-critical and also mixed-criticality systems – such as ours – it is very important to ensure the correctness not only at design time, but also at the working of the system. Traditional verification, as it was introduced in former post, can find design problems early in the design process. However, it would be a great idea to use the formally verified specification also at runtime to check if the runs of the system conforms to the specification.

There are many problems which cannot be handled by traditional design time verification. We generate the code from the design models. However, there is no assurance, that the code generator is correct. The second problem is that we can not verify our hardware. Problems caused by the hardware cannot be taken into account in the verification of the distributed logic. In addition, there can be transient or permanent errors in the components caused by short-circuit or many other kinds of events. Communication problems might result the loss of messages in the system, or errors in the network components might cause huge problems in the system.

Actually, in our small system we have faced many of the aforementioned problems, especially network delays caused serious problems and “accidents”.

Runtime verification

The output of running systems can be validated by external components checking conformance. For complex systems, only safety critical parts are monitored to be cost efficient. Our approach is to generate small monitors receiving the same inputs as the running component and verifies if the output is correct. Erroneous behavior can usually be detected by much smaller components. Imagine for example an airplane that with a safety criteria that it’s acceleration can’t go above 30m/s^2. The components that control the exact power of the engines can be complex, and done by many different parts of the system. Any error anywhere in the chain could lead to faulty behavior. A single component at the end can monitor the result, and if the final value would result in an acceleration higher than 30m/s^2, can signal an error. Such monitors are simple and efficient means to check certain properties.

Workflow

Monitoring components have a much lower complexity than the system itself, so they can easily be generated from models and we can trust in their correctness in a higher confidence. One of the most widely known modeling methods in the engineering world is statechart based modeling, so our approach is based on engineers creating statechart models, which then can be used to generate monitoring components with minimal non-generated code (glue code required to connect signals in the statecharts to the actual systems that they monitor).

Statechart based monitors

There are many flavors of statechart languages from low level ones which resemble state machines, to complex ones like UML statecharts. Our goal was to develop an intuitive and highly expressive statechart language with features like error state annotation to make monitor generation easy. A simple statechart can be described as following:

Editor

The described system simply switches between an odd and an even state on every tick signal. The features of the UML statecharts are fully available (entry and exit actions, state hierarchy, etc) with a few extensions, like parametrized handling of certain situation. A system specification can hold multiple statechart definitions which can communicate via shared signals.

Monitor generation from statecharts

We had a few ideas on how monitor generation should work, from flat, highly efficient monitors to high level ones that preserves the statechart’s hierarchy in the code itself (creating easily extendable and readable source files in the process). We also had a few options somewhere between the two extremities, but most systems either have a lot, or nearly no extra computing power that can be used for monitoring, so a midways approach isn’t really necessary. We ended up implementing most of the functionality for both the high and the low level monitor generators. So, let’s dive into how they work!

High level monitor generation

This method preserves the hierarchy of the statecharts completely. As a specification might consist of multiple statecharts, a statechart handler is responsible for the top level functionality. It works with a signal handler that connects the world to the environment – which handles the signal queues. Signal queues are one of the parts that has to be written by hand. It will mostly operate by either using shared memory (locking functions are built in) for the queues, or by attaching to a network interface to monitor packets, where certain packets raise certain signals. The statechart handler is responsible for the proper working of statecharts, which in turn contain states and transitions. These are all separate classes derived from a generic state and transition class, which allows the developers to extend the functionality of certain actions or guards. Names for states are also stored as strings which can be used to send informative error messages. For example, a state with a built in, and a custom entry action is represented as follows:

Monitor example

The handling of time is delegated to a separate class. This uses standard C++11 timing features and a clock with millisecond resolution by default, but can be easily changed to platform specific solutions: three functions need to be replaced in the class, one for getting the current time, one for getting the current time with an offset (which is needed for timers), and the comparison function between two timestamps.

This allows the generator not only to be used for monitor generation, but as a general tool to create object oriented C++ code from statecharts. This naturally results in a larger codebase than a low level monitor would, which is usually problematic when running on embedded systems.

Monitors with low overhead

After we realised that a BeagleBone PRU (which is what we wanted the monitor to run on) only has 8kB of code memory, a low level monitor generator had to be implemented. Code for handling hierarchy was the first to go – flat statecharts are just as good as hierarchical ones, when the memory limit is 8kB. The statechart names can also be omitted – even if it’s a less friendly method for the eye, storing an ID is enough to be to trace back which error state was reached. Creating child classes for states is also unacceptable overhead on such a small system, so we decided to use a general state class with function pointers. C++11 compilers are also seldom on embedded systems, so the code was downgraded to be C++98 compliant (which is the reason why no nice looking initialization lists are used). Then a single function running in an infinite loop checks for any changes in the signal que (in shared memory), and takes timesteps accordingly.

By now, you should have quite a bad feeling about how such code might look like. Well, wait no more, here is a small part from an example statechart, which shows how a transition is handled and the monitoring code is built:

Looks horrible, right? Still: that’s how low level monitors for embedded systems are born.

Integrating model railways with IBM Bluemix and Node-RED

Cyber-Physical Systems (CPS) are on one hand close to embedded systems as they are also built from sensors, controllers and actuators, where the sensors gather heterogeneous information from the environment, the controllers observe the gathered information and order the actuator to modify the environment according to the observed information. On the other hand, CPS systems are aiming to harvest the benefits of elastic cloud based resources to provide more sophisticated automation services.

As part of the MoDeS3 project we successfully integrated the safety logic that controls our model railways, with IBM Bluemix and Node-RED.

IBM Bluemix

Bluemix is an open standards, cloud platform for building, running, and managing apps and services. Bluemix is designed to make developers’ lives easier. That’s why it provides developer teams of all sizes with the flexibility to scale compute power at a very granular level, seamlessly collaborate on source code and shared APIs, and manage apps’ performance, logs and costs from a single dashboard.

Bluemix has three open source compute options to power your applications:

  • Cloud Foundry: Cloud Foundry is an open source PaaS that offers devs the ability to quickly compose their apps without worrying about the underlying infrastructure. Bluemix extends Cloud Foundry with a number of managed runtimes and services, enterprise-grade DevOps tooling, and a seamless overall developer experience.
  • IBM Containers: IBM Containers allow portability and consistency regardless of where they are run—be it on bare metal servers in Bluemix, your company’s data center, or on your laptop. Easily spin up images from our public hub or your own private registry.
  • VMs: Virtual machines offer the most control over your apps and middleware. Bluemix uses industry-leading OpenStack software to run and manage VMs in a public cloud, a dedicated cloud, or your own on-premises cloud. Key OpenStack services such as Auto Scaling, Load Balancing, and Object Storage can be used in conjunction with Bluemix services to build and run hybrid apps.

Source of information: IBM Bluemix homepage


Node-RED

Node-RED is a tool for wiring together hardware devices, APIs and online services in new and interesting ways. It provides a browser-based flow editor that makes it easy to wire together flows using the wide range nodes in the palette. Flows can be then deployed to the runtime in a single-click.With over 225,000 modules in Node’s package repository, it is easy to extend the range of palette nodes to add new capabilities.

The light-weight runtime is built on Node.js, taking full advantage of its event-driven, non-blocking model. This makes it ideal to run at the edge of the network on low-cost hardware such as the Raspberry Pi as well as in the cloud.

Source of information: Node-RED homepage


How were model railways integrated with the cloud?

As we describer earlier in a blogpost we designed the model railway control logic, also known as safety logic, with YAKINDU Statechart Tools. YAKINDU Statecharts enabled automatic code generation from the designed statecharts. This way we could directly create the implementation of the safety logic, based on statechart semantics.

However, generating codes automatically were not enough. We had to integrate custom Java codes to the generated codes through an interface. In this way we could connect the statecharts with the physical model railway track, including the BeagleBone Black based embedded controllers.

After that as an experiment we designed the communication module, originally implemented in Java and that is neccessary for communication between the statecharts, in Node-RED. The high-level signals used in the communication have been constructed as flows in Node-RED, depicted on the following figure.

As you can see, although different requests, originating from the left-hand side, has different flows containing some functions, they all end in the same response node. It was in order to make the design easier and less redundant, excluding the status and error logging nodes used for debug purposes.

So, as you may have already guessed the Node-RED flows and the generated statechart codes have been deployed into IBM Bluemix. Each turnout has its own statechart and they run separately, connected through the Node-RED flow, to make the communication easier and use cutting-edge Internet of Things technolgy!

We deployed each component (statecharts that control the turnouts and their nearby sections, and the communication module designed in Node-RED) into the IBM Bluemix as a container. Six containers were running the generated Java codes, each in its own, and the seventh container was deploying the Node-RED flow. They were put in the same subnetwork, so all the statecharts could communicate with the Node-RED flow as described above.

On a local machine working at the Fault Tolerant Systems Research Group at  BME, only a proxy module was running that received signals from the YAKINDU statecharts to stop the trains if neccessary. This module periodically transmitted status about the track to the cloud, so the statecharts could make decisions based on the real-world sensor information.


Conclusions

Although deploying a safety-critical system into the cloud is strongly opposed, due to network latencies, nondeterministic instabilities of the cloud, noisy neighbours in the virtual machines running in the cloud, etc, it was an interesting experimentation. It was fascinating to see that the section in danger, where the trains could collide, was disabled from the cloud. Despite we did not know where the containers were running exactly in the cloud (e.g. in the EU/USA/Asia), the network latency was low enough not to have serious implications in our case.

We were more than satisfied with the avilability and the stability of IBM Bluemix, so we strongly recommend to give it a try. It has a strong community which is eager to help you if you have any difficulties with the cloud services offer by IBM.

Last but not least, we would like to recommend Node-RED as well. If you are either a Java Script developer, or you would like to connect your embedded systems together, you may find it really useful.

Delivered in cooperation with Daniel.

Statecharts are everywhere! #5 – Validation example

As we mentioned in a former post, Bence, who is our colleague, has extended the validation rules embedded into YAKINDU Statechart Tools with new ones. The high-level purposes of the validation rules are to reduce the ambiguity and nondeterminism of the design models and to avoid bad design practises and structures.

Let’s see how it works in practise.

Let’s image we designed a statechart, that contains a composite state with two parallel regions as depicted on the next figure. Each region has two states, which are connected through transitions. Although most triggers are different in the two regions, there is a trigger, called Protocol.response, that is the same for both regions. Although these two transitions have the same trigger (Protocol.response) the respective actions are different: in the first first region Protocol.actionA, in the other region Protocol.actionB is the respective action. Since the execution order of transitions with the same trigger in parallel regions is undefined, it is a bad design pattern (so called antipattern).

Bence designed an EMF-IncQuery validation pattern to automatically recognize these kinds of design patterns. More on EMF-IncQuery validation patterns can be read in the respective blogpost here.

As the validation rules are evaluated incrementally by the EMF-IncQuery Validation Framework, warnings are showed in the Problems view of Eclipse. If we double click on a warning message, it automatically jumps to the respective model element, to help correct the error easily.

The PRU

It’s one thing we have a powerful hardware, but it does not matter if we can’t trust it. We need software reliability too. Of course, you can always compile a real-time operating system, but it won’t solve your problem. A real-time OS guarantees the maximum time required to serve your interrupt, but it does not guarantee correctness. A real-time OS can run into a kernel panic too. Therefore you need something extra over your OS, which can guarantee you reliability.

This extra is called PRU, the Programmable Realtime Unit. It’s a very special, and interesting idea, and now only the BeagleBone Black has it. The PRU is a very small processor (32 bit, 400 MHz, 8 kB program memory, 8 kB data memory). The PRU’s architecture is similar to the microcontrollers, but it is integrated next to the CPU.

The block diagram of the PRU

The PRUs can control pins, communicate with the application processor. Why are they so useful? With an operating system, many level of abstraction comes into the equation when you are dealing with reliability: drivers, file systems, complex libraries. You need a simple, deterministic unit which can watch over your complex application. If something goes wrong, you can be sure that it will detect the error and take preventive measures.

The BeagleBone Black has two of these units, where we can embed monitors, and other helpful little applications. With these, we can guarantee more reliability over the real-time OS.

The past and the future of the hardware – Part 2

As part 1 depicted, using microcontrollers have serious implications. For the future uses of this project, we decided not to focus on the code generation side, and compress the code into the AVR, but instead invest in a bigger hardware.
With a faster computing unit running a Linux operating system, many projects, and addons can run in the same time, allowing much more people to experiment. With a central deployment system, you can easily deploy applications, operating systems onto the embedded hardwares.

Although Raspberry Pis are great embedded computers, it turned out they are not reliable. It’s not a big deal for everyday applications if the Pi restarts suddenly, but in our application this can be fatal, therefore we have choosen the BeagleBone Black single board computer (SBC). Let’s not forget, our environment is safety critical one, so we need not only computing power, but reliable hardware as well. 

The Beaglebone Black

It has 4 GB onboard flash memory, so you don’t need SD card. The expander header has more than twice the pin count of a Raspberry Pi 2. The Ethernet is not USB-based, it’s handled by the processor. The BeagleBone Black (BBB) is like a Raspberry Pi, but it is more designed for embedded applications, where media capabilities are not priority.